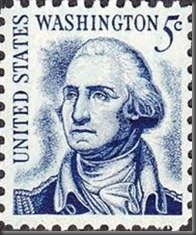
One of the interesting observations in my first few months in US: there is no price printed in the new mail stamps!
It is interesting because as a former student of economics, I think US Post system did a nice attempt to beat the so called “menu cost” which should honor to Harvard economist Mankiw. Literally the menu cost is the cost of a restaurant to print new menus due to price adjustment. In this story, it is the cost of US Post to print new stamps with adjusted price.
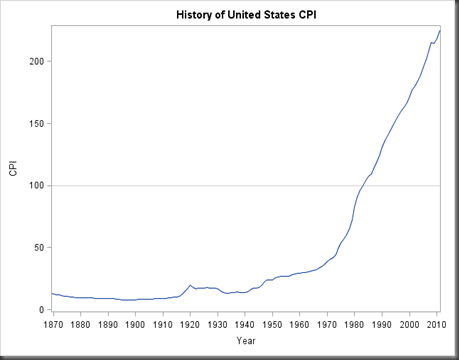
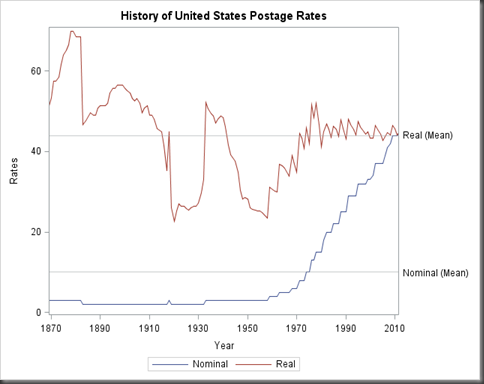
Why US Post need to print new stamps with new price? It is because of the inflation! I took a quick search, the first class postage rate was 5 cents in 1963 and never changed until 1968. But during this 5 years, the CPI (consumer price index, one of the robust measures of inflation; data see here, codes see below) increased from 30.6 to 33.4, which means, the actual price (see red line below) of a postage in 1967 was even less than in 1963!
Why US Post didn’t adjust the postage rate accordingly in these years? In a free market, prices are supposed to be adjusted immediately upon market demands and supplies. A school of economics argues that even in free markets, the prices can be sticky. One of causes of such price stickiness is the menu cost. In this case, US Post knew that the actual cost of posting a mail was up, but it still didn’t will to print new stamps with new price due to printing cost itself (suppose there were lots of stocks) and even the cost to inform people(and such small costs).
Now US Post doesn’t want to lose money by supplying mail services with a price under market value while also want to avoid so called menu cost, then a stamp without price printed seems good enough to solve such dilemma!
/———–codes for graphics go here and it’s nice to post the first SGPLOT in this blog while watching NCAA game of NCSU vs Kansas————–/
data rate;
input Year Nominal Real CPI;
datalines;
1866 3 44.0 15.4
1867 3 47.4 14.3
1868 3 49.1 13.8
(data see here)
;proc means data=rate;
var Nominal Real CPI;
run;proc sgplot data=rate;
title “History of United States CPI”;
series x=year y=cpi;
xaxis values= (1870 to 2010 by 10);
refline 100 / transparency = 0.5;
run;proc sgplot data=rate;
title ‘History of United States Postage Rates’;
series x=Year y=Nominal;
series x=Year y=Real;
xaxis values= (1870 to 2010 by 10);
yaxis label=’Rates’;
refline 10 44 / transparency = 0.5
label = (‘Nominal (Mean)’ ‘Real (Mean)’);
run;


